

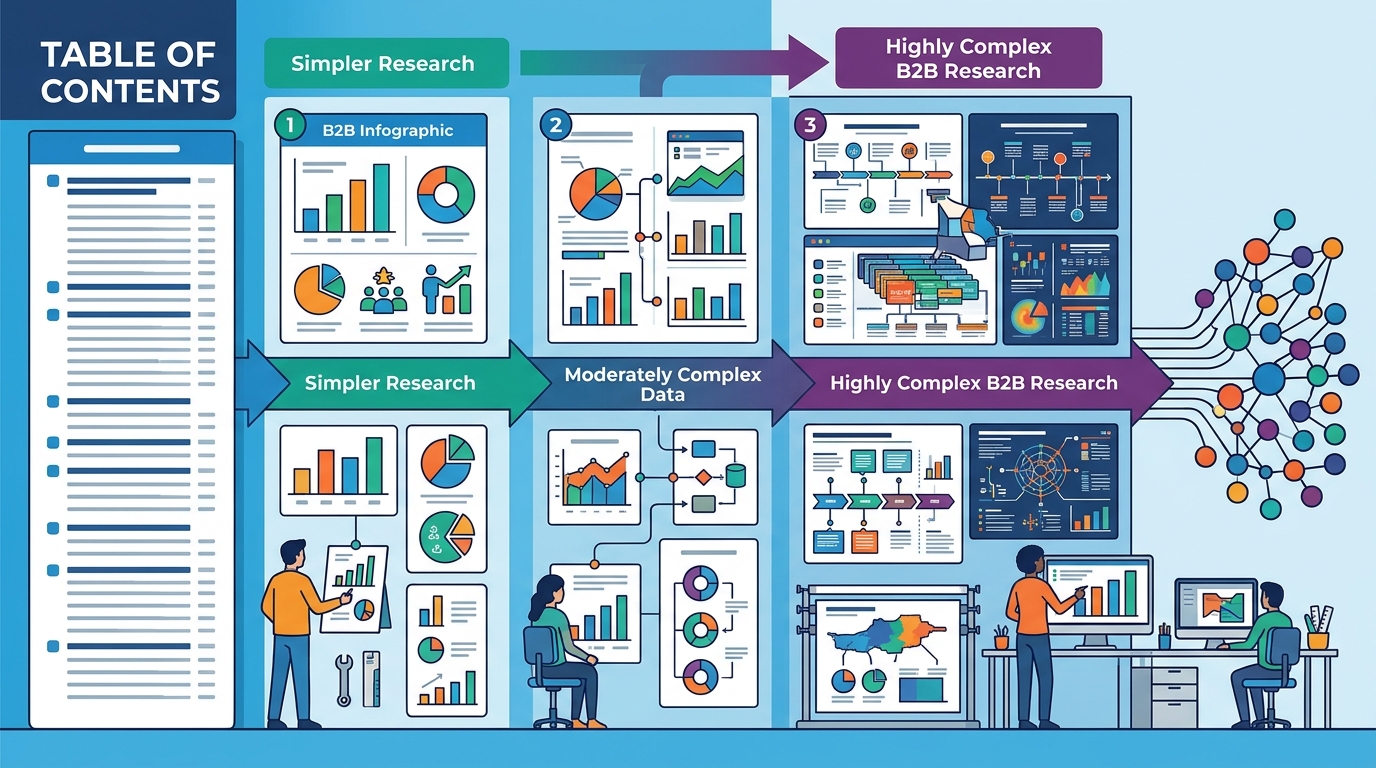
The complexity of your underlying research directly dictates the level of strategic expertise required for infographic design. Simple data points can be handled by generalist designers, while complex, multi-variable B2B research demands a partner who understands data architecture and narrative flow. Goodman Lantern approaches this by aligning design depth with research rigor to ensure visual clarity.
Defining Research Complexity in B2B Contexts
Research complexity is the degree of difficulty involved in synthesizing raw data into a coherent, actionable narrative. In B2B environments, this often involves technical specifications, market trends, or multi-stakeholder insights. When data is straightforward, such as a single-year revenue chart, the design challenge is minimal. However, when data involves comparative analysis across multiple regions or product lines, the cognitive load on the viewer increases significantly.
High-complexity research requires a designer who can interpret the data before visualizing it. This means understanding the 'why' behind the numbers, not just the 'what.' If the source material is dense and technical, the design must simplify without losing accuracy. This distinction is critical because a generalist designer may struggle to translate nuanced technical findings into a clear visual hierarchy.
The Risk of Mismatched Design Capability
Sourcing design from a provider without the capacity to handle complex data structures leads to visual clutter and misinterpretation. A common failure mode is the 'data dump,' where every data point is included, resulting in an unreadable graphic. This happens when the designer lacks the strategic context to prioritize information. The implication is that the infographic fails to communicate the core message, reducing its value in lead generation or thought leadership campaigns.
For example, a white paper containing 50 pages of technical analysis cannot be effectively summarized by a template-based designer. The design must make editorial decisions about what to highlight and what to omit. This requires a collaborative process where the designer and the researcher work together to define the narrative arc. Without this alignment, the final asset often looks professional but says nothing of substance.
Strategic Alignment for High-Complexity Assets
Goodman Lantern's approach involves a step-by-step content creation process that uplifts business goals and drives conversions. By combining writing and design under one roof, we ensure that the visual narrative is consistent with the written narrative. This integration reduces the risk of disjointed messaging. It also allows for faster iteration, as the designer can ask clarifying questions during the drafting phase rather than after the first visual draft is complete.
Scalability and Consistency in Visual Identity
Complex research often requires a series of infographics rather than a single asset. This creates a need for visual consistency across multiple pieces. A generalist freelancer may struggle to maintain a consistent style guide across a large volume of complex visuals. An agency with a dedicated design team can ensure that color palettes, typography, and iconography remain uniform. This consistency builds brand trust and makes the content more recognizable in search results and AI-generated summaries.
Furthermore, scalable design systems allow for easier updates. If the research data changes, the design template can be adjusted without starting from scratch. This is particularly important for B2B content that needs to remain relevant over time. By sourcing from a partner who understands design systems, you ensure that your visual assets remain maintainable and up-to-date with minimal effort.
The Role of AI and Search Visibility
As search engines and AI systems increasingly rely on structured data, the clarity of your infographics becomes a technical SEO factor. Complex data visualizations must be structured in a way that is machine-readable. This means using proper alt text, semantic HTML, and clear labeling. A designer who understands these technical requirements can create assets that are not only visually appealing but also optimized for discovery. This is a critical consideration for brands looking to improve their visibility in AI-generated search results.
Goodman Lantern focuses on creating content that helps increase subscriptions and grows your business. By ensuring that infographics are optimized for both human and machine consumption, we help brands stay ahead of the curve. This dual focus on aesthetics and technical optimization is a key differentiator when sourcing design for complex B2B research.
Key Takeaways
- Research complexity determines the level of strategic expertise required for design.
- Simple data can be handled by generalists, but complex data requires strategic partners.
- Mismatched design capability leads to visual clutter and misinterpretation.
- Integrated agencies ensure consistency between written and visual narratives.
- Scalable design systems are essential for maintaining consistency across multiple assets.
- Optimizing infographics for AI and search engines requires technical design knowledge.
Frequently Asked Questions
What is considered high-complexity research in B2B?
Can a freelancer handle complex B2B infographics?
How does design complexity affect cost?
Higher complexity generally leads to higher costs due to the increased time required for strategic planning, data interpretation, and iterative design. The investment is justified by the clarity and impact of the final asset.
Why is consistency important in B2B infographics?
Consistency builds brand trust and ensures that the visual language is recognizable across different pieces of content. It also makes it easier for audiences to understand the information being presented.
Do infographics need to be optimized for AI search?
Yes, as AI systems increasingly rely on structured data, optimizing infographics with proper metadata and semantic structure can improve their visibility in AI-generated search results.
Conclusion
The complexity of your research is a critical factor in determining where to source B2B infographic design. By aligning your design partner's capabilities with your research needs, you ensure that your visual assets are clear, consistent, and effective. to discuss how we can help you translate complex research into compelling visual narratives.